ConnectPed
Assistant Secretary
Will Watts
Engineering and Operations
605 Suwannee St.
Tallahassee, FL 32399
Tel: 850-414-5236
Fax: 850-414-5261
E-Mail Us
Additional Contacts
Staff Directory

Welcome
ConnectPed was made available to the public in 2020. It displays pedestrian and bicycle related data geographically on a map. Having these data all in one place facilitates data driven decision making and sharing information with FDOT’s partners.
For marketing purposes use this URL: www.fdot.gov/connectped
Get Started
Use Google Chrome or Mozilla Firefox for the best experience.
Access ConnectPed here or through the link below:
https://fdot.maps.arcgis.com/apps/webappviewer/index.html?id=0e179df3bae4403cbac896f42f98fe13
Click the 'layer list' icon to see the data available. ![]()
If a layer is grayed out, zoom in to the map until it becomes available.
Go Deeper
How to add transportation labels to imagery base map:
In the Base map Gallery, select the imagery base map of your choice
In the Layer List, turn on World Transportation
Metadata
To find out more information about the layers, access the metadata. Click the eclipse next to the data. ![]()
Then select Description or Show Item Details
For metadata that is not accessible
from the items description please click on the info widget ![]()
Download GIS Layer
For more sophisticated analysis, users who know how to do so may download
the layer's shapefile for use in ArcMap or a similar GIS product here or through the link below:
https://ftp.fdot.gov/file/d/FTP/FDOT/co/planning/transtat/gis/shapefiles/
Enter Guest as Username and do not put in a Password.
Add GIS Layer
Create a zip folder of all the files in the GIS layer except Type: XML Document. Click on the add data icon in ConnectPed ![]() and navigate to your zip folder.
and navigate to your zip folder.
How to create and share a drawing in ConnectPed
Let's
say you want to show a proposed alignment next to and existing alignment.
- First, turn on the relevant existing layer(s).
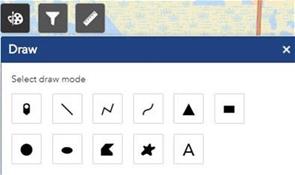
- Then, click on the painter’s palette icon
 from the upper left-hand of the screen. The Draw dialog box will appear.
 - There are various draw modes, points, lines and polygons. Select the draw mode that best meets your need. If you want to make adjustments to the color, transparency, outline color, outline width, show area measurement, or show perimeter measurement
of the circle, scroll down in the Draw dialog box.

- You may want to start by putting points everyplace along the route where there is a turn. I zoom in to the intersections where there is a turn and Click on the map location to add a shape, or press down to start and let go to finish. (Press CTRL to enable snapping).
- At the very bottom of the Draw window you can select Undo, Redo or Clear.
- Next, I want to draw lines connecting the dots to show the proposed route. Click on the Palette icon again if not still open. Select the line in the Draw dialog box. The same options to personalize are available. I zoom in to the area and connect the dots.
- Now I want to save the image and send it to a colleague.
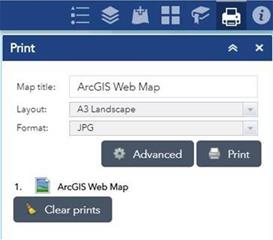
- Close the Draw window. In the upper right hand corner of the screen click on the Print icon.
- In map title, give the map a name.
- In layout, select the size print out you need. I changed the Layout to A3 Landscape
- In Format select the format for the type of output you need. I selected JPG image file
- For additional customize, click Advanced and make any changes you’d like. I keep the default settings. Note: DPI should be set at 300 or greater for best quality.
- Click Print.
- You will see a number and title for your print.

- Click on the this line to open it. Right click the picture and select Save Image As…
- Save the picture where you would like.
- When you close ConnectPed, your drawings will be gone. There is not a way to save them.
Get Help
Contact FDOT's Service Desk by phone number, 1-866-955-4357, or email, fdot.servicedesk@dot.state.fl.us.

